Warning: preg_grep(): Compilation failed: quantifier does not follow a repeatable item at offset 165 in /var/www/tg-me/post.php on line 75 Библиотека дата-сайентиста | Data Science, Machine learning, анализ данных, машинное обучение | Telegram Webview: dsproglib/6303 -
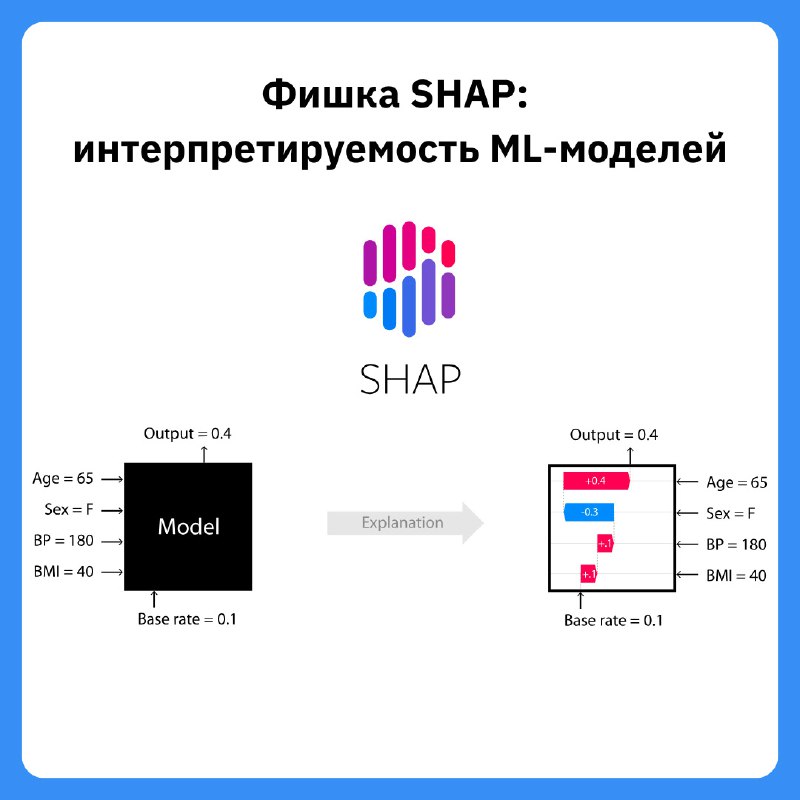
SHAP (SHapley Additive exPlanations) — это мощный инструмент для объяснения предсказаний моделей машинного обучения. Он основан на значениях Шепли из теории игр и позволяет разобрать вклад каждого признака в итоговый результат модели.
📍Что делает SHAP: ➖ Объясняет любой ML-модели, от XGBoost и LightGBM до нейросетей и трансформеров ➖ Выявляет ключевые признаки, влияющие на предсказания ➖ Создаёт наглядные визуализации, такие как водопадные графики, force plots, scatter plots и beeswarm-графики ➖ Работает с деревьями решений, нейросетями и линейными моделями
📍Ключевые приёмы: ➖ Waterfall plot — детальный разбор влияния признаков ➖ Beeswarm plot — топ-важных признаков по всей выборке ➖ Dependence plot — анализ взаимодействий признаков
📍Пример использования
1⃣ Установка:
pip install shap
2⃣ Простая демонстрация для XGBoost:
import xgboost import shap
# Обучаем модель X, y = shap.datasets.california() model = xgboost.XGBRegressor().fit(X, y)
The SSE was the first modern stock exchange to open in China, with trading commencing in 1990. It has now grown to become the largest stock exchange in Asia and the third-largest in the world by market capitalization, which stood at RMB 50.6 trillion (US$7.8 trillion) as of September 2021. Stocks (both A-shares and B-shares), bonds, funds, and derivatives are traded on the exchange. The SEE has two trading boards, the Main Board and the Science and Technology Innovation Board, the latter more commonly known as the STAR Market. The Main Board mainly hosts large, well-established Chinese companies and lists both A-shares and B-shares.
That strategy is the acquisition of a value-priced company by a growth company. Using the growth company's higher-priced stock for the acquisition can produce outsized revenue and earnings growth. Even better is the use of cash, particularly in a growth period when financial aggressiveness is accepted and even positively viewed.he key public rationale behind this strategy is synergy - the 1+1=3 view. In many cases, synergy does occur and is valuable. However, in other cases, particularly as the strategy gains popularity, it doesn't. Joining two different organizations, workforces and cultures is a challenge. Simply putting two separate organizations together necessarily creates disruptions and conflicts that can undermine both operations.
Библиотека дата сайентиста | Data Science Machine learning анализ данных машинное обучение from us