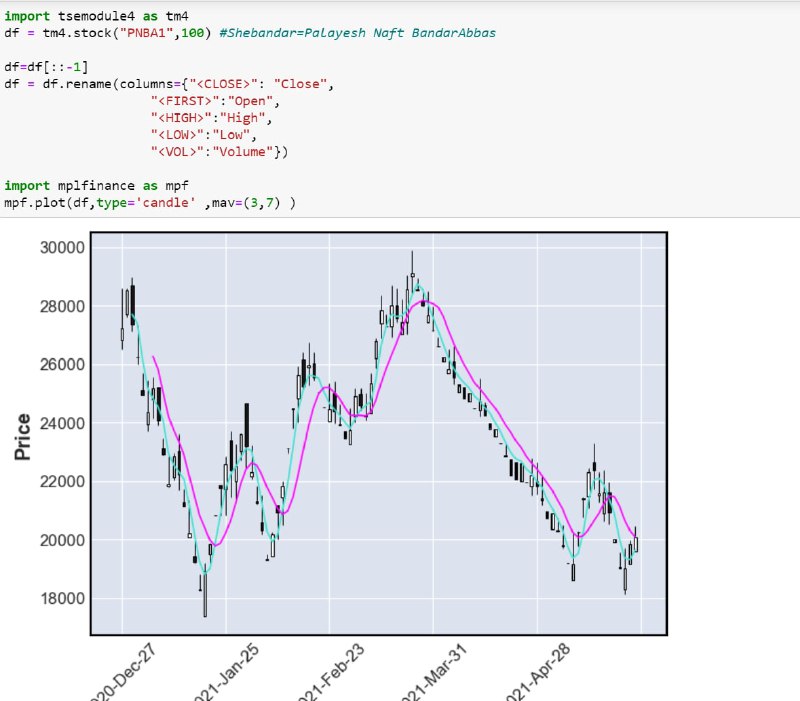
رسم نمودارهای مالی برای بازار ایران قبلا در این پست، طریق رسم انواع نمودارهای مالی مانند OHLC، Candle و ... را با استفاده از کتابخانه mplfinance توضیح داده بودم. خیلی از دوستان، در خصوص رسم نمودارهای مالی برای بازار ایران سوال پرسیده بودند. برای این کار کافی است نام ستون ها را به نام های استاندارد تبدیل کنیم. در مثال این پست، اطلاعات 100 روز اخیر سهم شبندر با استفاده از ماژول tsemodule4 دریافت و رسم شده است.
رسم نمودارهای مالی برای بازار ایران قبلا در این پست، طریق رسم انواع نمودارهای مالی مانند OHLC، Candle و ... را با استفاده از کتابخانه mplfinance توضیح داده بودم. خیلی از دوستان، در خصوص رسم نمودارهای مالی برای بازار ایران سوال پرسیده بودند. برای این کار کافی است نام ستون ها را به نام های استاندارد تبدیل کنیم. در مثال این پست، اطلاعات 100 روز اخیر سهم شبندر با استفاده از ماژول tsemodule4 دریافت و رسم شده است.
That growth environment will include rising inflation and interest rates. Those upward shifts naturally accompany healthy growth periods as the demand for resources, products and services rise. Importantly, the Federal Reserve has laid out the rationale for not interfering with that natural growth transition.It's not exactly a fad, but there is a widespread willingness to pay up for a growth story. Classic fundamental analysis takes a back seat. Even negative earnings are ignored. In fact, positive earnings seem to be a limiting measure, producing the question, "Is that all you've got?" The preference is a vision of untold riches when the exciting story plays out as expected.
At a time when the Indian stock market is peaking and has rallied immensely compared to global markets, there are companies that have not performed in the last 10 years. These are definitely a minor portion of the market considering there are hundreds of stocks that have turned multibagger since 2020. What went wrong with these stocks? Reasons vary from corporate governance, sectoral weakness, company specific and so on. But the more important question is, are these stocks worth buying?