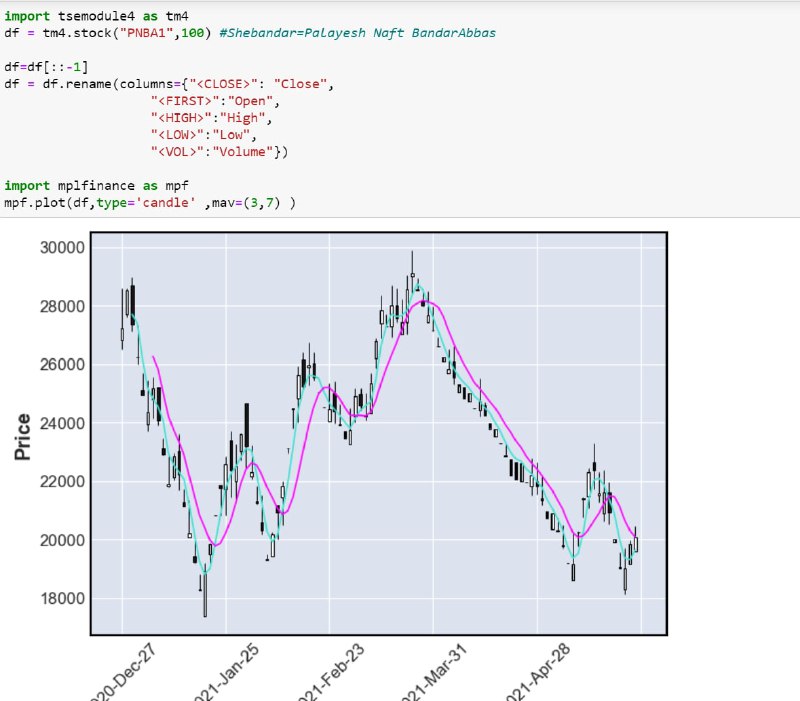
رسم نمودارهای مالی برای بازار ایران قبلا در این پست، طریق رسم انواع نمودارهای مالی مانند OHLC، Candle و ... را با استفاده از کتابخانه mplfinance توضیح داده بودم. خیلی از دوستان، در خصوص رسم نمودارهای مالی برای بازار ایران سوال پرسیده بودند. برای این کار کافی است نام ستون ها را به نام های استاندارد تبدیل کنیم. در مثال این پست، اطلاعات 100 روز اخیر سهم شبندر با استفاده از ماژول tsemodule4 دریافت و رسم شده است.
رسم نمودارهای مالی برای بازار ایران قبلا در این پست، طریق رسم انواع نمودارهای مالی مانند OHLC، Candle و ... را با استفاده از کتابخانه mplfinance توضیح داده بودم. خیلی از دوستان، در خصوص رسم نمودارهای مالی برای بازار ایران سوال پرسیده بودند. برای این کار کافی است نام ستون ها را به نام های استاندارد تبدیل کنیم. در مثال این پست، اطلاعات 100 روز اخیر سهم شبندر با استفاده از ماژول tsemodule4 دریافت و رسم شده است.
With the help of the Search Filters option, users can now filter search results by type. They can do that by using the new tabs: Media, Links, Files and others. Searches can be done based on the particular time period like by typing in the date or even “Yesterday”. If users type in the name of a person, group, channel or bot, an extra filter will be applied to the searches.
Tata Power whose core business is to generate, transmit and distribute electricity has made no money to investors in the last one decade. That is a big blunder considering it is one of the largest power generation companies in the country. One of the reasons is the company's huge debt levels which stood at ₹43,559 crore at the end of March 2021 compared to the company’s market capitalisation of ₹44,447 crore.