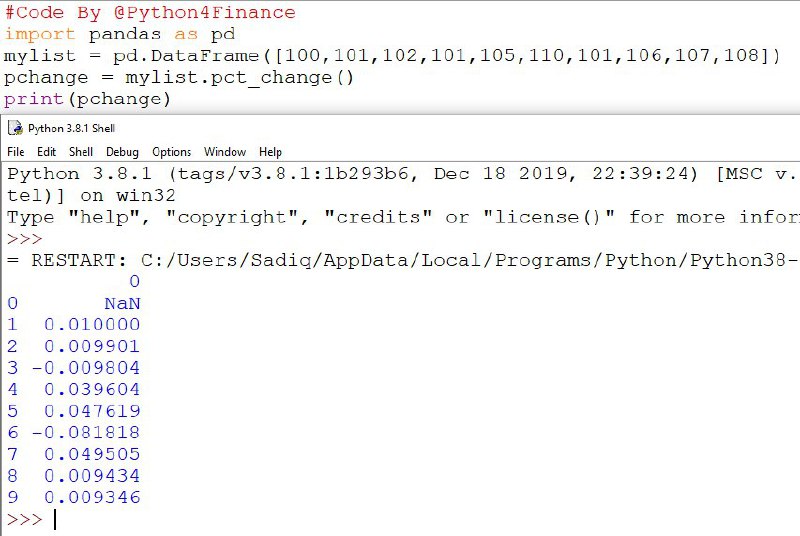
یکی از کارهایی که در بازار سرمایه و به طور کلی در بیشتر محاسبات سری های زمانی به آن مواجه هستیم، به دست آوردن درصد تغییرات در یک لیست است. (برای مثال محاسبه ضریب تغییرات (cv) ، محاسبه Betaی سهم و...) برای به دست آوردن درصد تغییرات (البته برای حالت ساده نه لگاریتمی) می توانید از متد pct_change در کتابخانه پانداس استفاده کنید. در تصویر بالا، یک نمونه ساده برای محاسبه درصد تغییرات در یک لیست نشان داده شده است.
یکی از کارهایی که در بازار سرمایه و به طور کلی در بیشتر محاسبات سری های زمانی به آن مواجه هستیم، به دست آوردن درصد تغییرات در یک لیست است. (برای مثال محاسبه ضریب تغییرات (cv) ، محاسبه Betaی سهم و...) برای به دست آوردن درصد تغییرات (البته برای حالت ساده نه لگاریتمی) می توانید از متد pct_change در کتابخانه پانداس استفاده کنید. در تصویر بالا، یک نمونه ساده برای محاسبه درصد تغییرات در یک لیست نشان داده شده است.
The lead from Wall Street offers little clarity as the major averages opened lower on Friday and then bounced back and forth across the unchanged line, finally finishing mixed and little changed.The Dow added 33.18 points or 0.10 percent to finish at 34,798.00, while the NASDAQ eased 4.54 points or 0.03 percent to close at 15,047.70 and the S&P 500 rose 6.50 points or 0.15 percent to end at 4,455.48. For the week, the Dow rose 0.6 percent, the NASDAQ added 0.1 percent and the S&P gained 0.5 percent.The lackluster performance on Wall Street came on uncertainty about the outlook for the markets following recent volatility.
The S&P 500 slumped 1.8% on Monday and Tuesday, thanks to China Evergrande, the Chinese property company that looks like it is ready to default on its more-than $300 billion in debt. Cries of the next Lehman Brothers—or maybe the next Silverado?—echoed through the canyons of Wall Street as investors prepared for the worst.