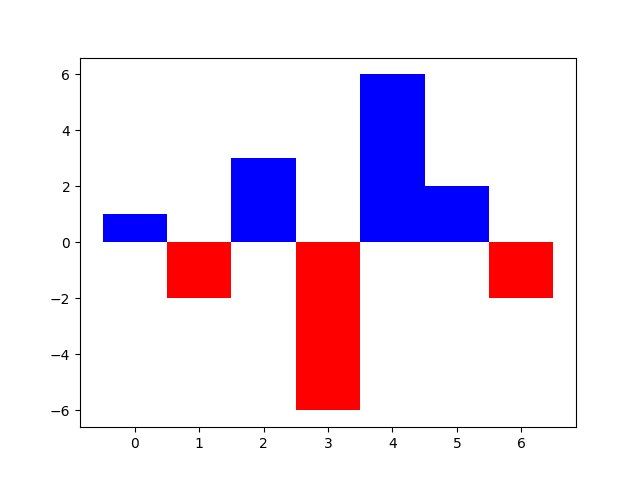
رسم نمودارهای مثبت و منفی در Matplotlib در ادامه یک نمونه کد برای رسم نمودارهایی که مقادیر مثبت و منفی با رنگ های مختلف نمایش داده شده اند با استفاده از کتابخانه matplotlib قرار داده شده است.
import matplotlib.pyplot as plt x = range(7) data_pos = [1,0,3,0,6,2,0] data_neg = [0,-2,0,-6,0,0,-2]
رسم نمودارهای مثبت و منفی در Matplotlib در ادامه یک نمونه کد برای رسم نمودارهایی که مقادیر مثبت و منفی با رنگ های مختلف نمایش داده شده اند با استفاده از کتابخانه matplotlib قرار داده شده است.
import matplotlib.pyplot as plt x = range(7) data_pos = [1,0,3,0,6,2,0] data_neg = [0,-2,0,-6,0,0,-2]
Launched in 2013, Telegram allows users to broadcast messages to a following via “channels”, or create public and private groups that are simple for others to access. Users can also send and receive large data files, including text and zip files, directly via the app.The platform said it has more than 500m active users, and topped 1bn downloads in August, according to data from SensorTower.
Telegram is riding high, adding tens of million of users this year. Now the bill is coming due.Telegram is one of the few significant social-media challengers to Facebook Inc., FB -1.90% on a trajectory toward one billion users active each month by the end of 2022, up from roughly 550 million today.