
tg-me.com/python4finance/465
Create:
Last Update:
Last Update:
رسم نمودارهای مثبت و منفی در Matplotlib
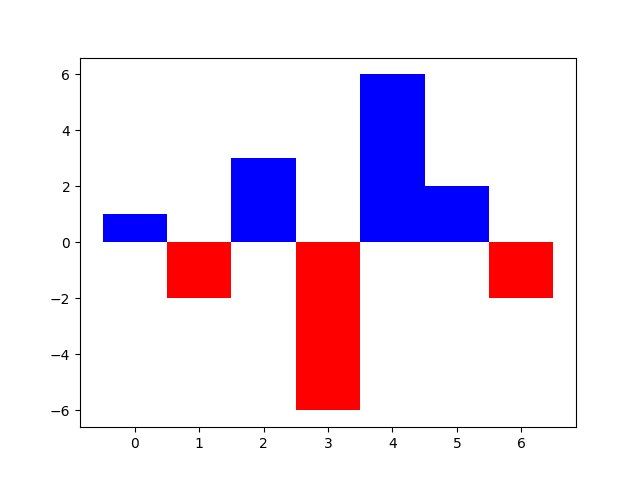
در ادامه یک نمونه کد برای رسم نمودارهایی که مقادیر مثبت و منفی با رنگ های مختلف نمایش داده شده اند با استفاده از کتابخانه matplotlib قرار داده شده است.
import matplotlib.pyplot as plt
x = range(7)
data_pos = [1,0,3,0,6,2,0]
data_neg = [0,-2,0,-6,0,0,-2]
plt.bar(x, data_pos, width=1, color='b')
plt.bar(x, data_neg, width=1, color='r')
plt.show()
#نمودار
#پایتون مالی
#matplotlib
@python4finance
BY Python4Finance
Share with your friend now:
tg-me.com/python4finance/465